Chilgrove House

Water levels have been measured at Chilgrove House since 1836. The well penetrates the Seaford Chalk Formation. We believe this well has the longest continuous observation of water levels in the UK, and possibly the world.
Our enquiries service can help you to access groundwater level data for this well.
Hydrograph
Show data from :-
Information about the well
| Chilgrove House | |
|---|---|
| Wellmaster ID | SU81/1 |
| NGR | 4835 1143 |
| Datum | 77.18 m AOD |
| Monitoring details | |
| Type | Groundwater Level |
| Aquifer | Chalk |
| Confinement | Unconfined |
| Depth | 62.03 m |
| Record | |
| Monitored by | EA Southern |
| Records commence | 1836 |
| Records end | Active |
Hydrogeological setting
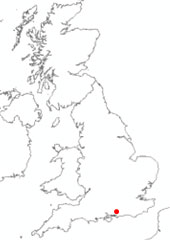
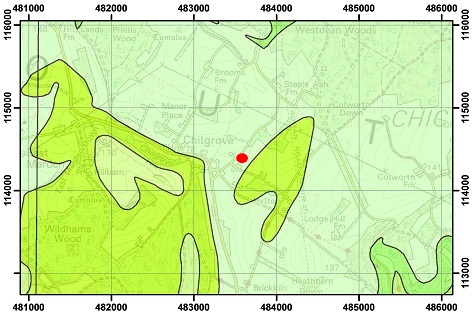
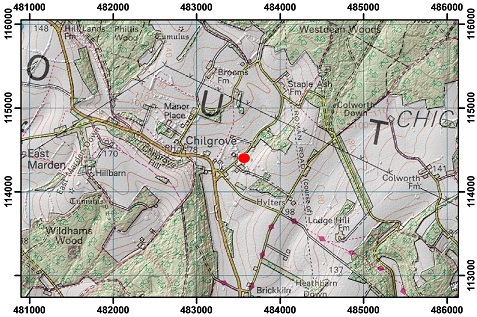
The well is located on head deposits over Seaford Chalk Formation. It is located in a branch off the generally dry Chilgrove valley that it joins about 400m to the south-west. This valley joins the River Lavant valley just north of Lavant.

Well or borehole construction
The well consists of a shaft , 0.9 metres in diameter to 43.74 m, and a 147mm borehole, sunk in 1934, to 62.03m. Casing runs from the surface into the bored section.
It was originally 41.15 m deep and due to siltation was cleaned out and deepened in 1855 after the drought of 1854 to 43.74 m. It was further deepened in March 1934 by a 114 mm diameter borehole (given as 152 mm in Thompson, 1938) to a depth of 62.03 m.
Hydrograph response
The well shows an annual sinusoidal response typical of the unconfined chalk. Annual fluctuations are usually around 20 to 30 m, but monthly rises in level have exceeded 34 m.
The well occasionally overflows (December 1852, January 1994 (for 18 days) and December 2000). The bourne rising as high up the valley as Chilgrove is known to have occurred in December 1960, January 1994 and December 2000, and is likely to have also occurred in winter 1852-53.
Low levels in December 1854 and early 1934 may have been truncated due to siltation prior to deepening. Since then the lowest levels recorded coincide with the top of the borehole. This is a couple of metres below the top of the casing. It is assumed, but not known, that water level measurements were made in the borehole rather than the well at these times.
Data issues
Early data is subject to various errors. The data for the period March 1942 to April 1943 was not collected and is extrapolated from a well at Compton (SU 7755 1490), 6.5 km to the west.
References

Acknowledgements
At a national level, groundwater level monitoring data is collected and managed by the Environment Agency (England), the Scottish Environmental Protection Agency, Natural Resources Wales and the Department of the Environment (Northern Ireland). Access to the data they collect (which includes many monitoring sites beyond those highlighted on these pages) and curate is online in England (DEFRA) and Scotland (SEPA).
Contact
Contact Contact enquiries for further information.


