Improving the understanding of the controls on groundwater flooding at the regional scale
, rivers (blue) and urban areas (grey)")
Over the past two decades there have been a number of major groundwater flooding events on the outcrop of the Chalk in England, with serious implications for people, property, infrastructure and transport. Although groundwater flood risk has been investigated through localised case studies, at the regional scale limited research has been carried out on the hydrogeological controls on groundwater flooding. With this in mind, BGS recently undertook a study to improve the understanding of the variations over space and time in groundwater flooding across the Chalk of south–east England (Figure 1).
We determined the impact of the flood event by analysing the length of groundwater flood alerts issued by the Environment Agency, flood–related BBC travel alerts and media reports of flooding. We then developed a new index to systematically quantify regional differences in groundwater levels during flood events, the Standardised Groundwater Flooding Index (SGFI).
This research has improved our understanding of the spatial variability of groundwater flooding behaviour in the Chalk, which will assist the UK government national crisis management during major groundwater flooding events.
Groundwater flooding in winter 2013/14: Gathering evidence of the impact
 total winter rainfall (mm), (b) total winter rainfall as percentage of the long term average, & groundwater flood media reports, (c) groundwater flood alert length, (d) travel alert length.")
In the study we gathered evidence of the impact of groundwater flooding on the Chalk in this region during the winter of 2013/14. Figure 2 shows the impact of the flood event as indicated by the length of groundwater flood alerts issued by the Environment Agency, flood–related BBC travel alerts and media reports of flooding, the vast majority of which were located on the Chalk outcrop and assumed to be due to groundwater emergence. The rainfall distribution is reflected in the impact data. There were significantly more groundwater flood alerts in the South Downs and Wessex areas than in the Chilterns. This is in contrast to previous events such as in the winter of 2001, when substantial groundwater emergence occurred in the Chilterns area.
Developing new analytical tools to understand groundwater flooding
We then developed a new index to systematically quantify regional differences in groundwater levels during flood events. The Standardised Groundwater Flooding Index (SGFI) is the transformation of monthly groundwater levels to a normal distribution (zero mean, unit variance), with all negative normalised values set to zero. This was applied to 26 boreholes with monthly groundwater levels from 1980 to 2014. Clustering was undertaken on the SGFIs to identify observation boreholes with similar responses. Two cluster groups were identified (Figures 3 and 4).
- Group 1: Groundwater levels flashy, rising and recessing rapidly in response to recharge. The highest groundwater levels across the full period analysed occurred in the 2013/14 flood
- Group 2: groundwater levels slow to rise in response to recharge and to recess, sustaining high and low levels for longer periods compared with other group. Several multi–year periods where SGFI remains >0. Highest groundwater levels occurred in the 2000/01 flood.
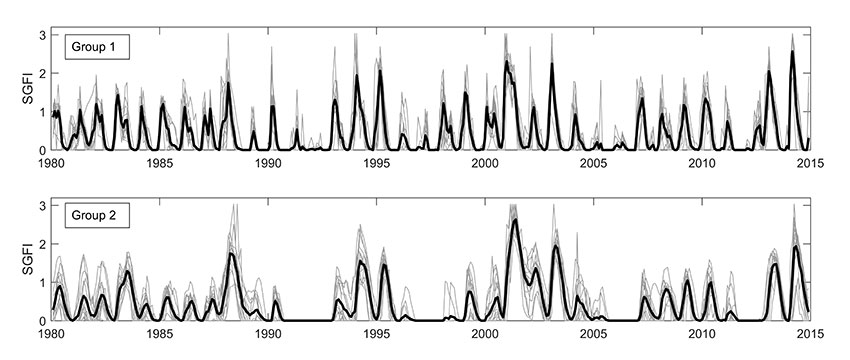
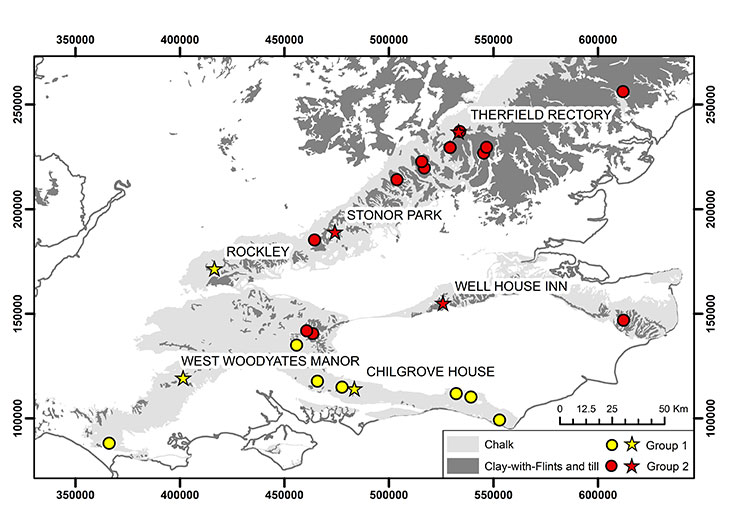
The analysis highlights clear spatial differences in groundwater level response during a flood event (Figure 4). Group 2 sites (mostly in the Chilterns and North Downs) respond slower to rainfall inputs with greater lag between rainfall and groundwater levels compared to Group 1 (Wessex and South Downs areas). A primary difference in the hydrogeology of the two cluster areas is the extent of low permeability Clay–with–Flints and till in the north of study region. These deposits lie above the Chalk and act to slow and attenuate the recharge signal, thereby causing groundwater levels to rise and fall more slowly. Our analysis suggests that bulk permeability of the Chalk beneath the Clay–with–Flints and till is lower than elsewhere, and as a result the Chalk takes longer to drain, prolonging flooding conditions once they are initiated.
Implications for groundwater flood management
This study has significant implications for management of groundwater flooding at the regional scale:
- In the southerly Group 1 area, emergency responders should anticipate relatively rapid onset when antecedent and ongoing rainfall conditions make groundwater flooding likely.
- In the more northerly Group 2 area, a relatively slow rise in groundwater levels does not mean groundwater flooding will not occur but, if it does, responders should anticipate longer persistence than Group 1 area.
- This new understanding of the spatial variability of groundwater flooding behaviour in the Chalk will assist government national crisis management during major groundwater flooding events.
Overall, the study identifies the controls on groundwater flooding as a combination of antecedent conditions, rainfall inputs and Chalk and superficial deposit hydraulic properties. The event of 2013/14, analysis shows the locations of groundwater flooding were predominantly controlled by rainfall distribution.
Publications
This work was reported in Ascott, M J, Marchant, B P, Macdonald, D M J, McKenzie, A A, Bloomfield, J P. 2017. Improved understanding of spatiotemporal controls on regional scale groundwater flooding using hydrograph analysis and impulse response functions. Hydrological Processes.
Contact
Contact BGS Enquiries for further information.


