Groundwater monitoring in Lancashire
Groundwater-bearing rocks
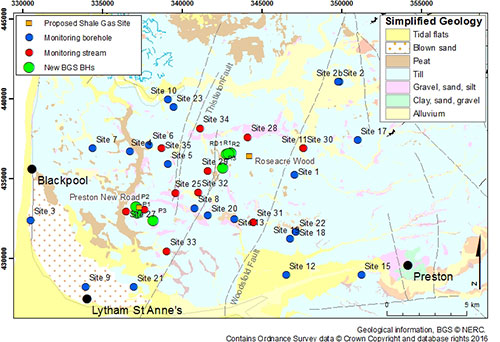
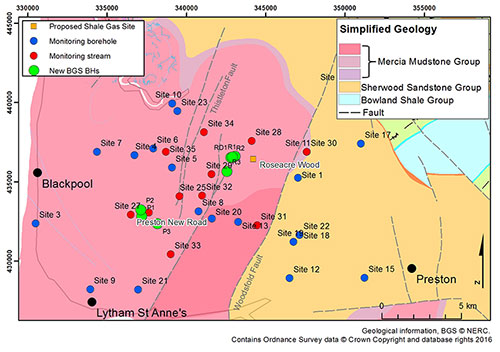
There are two significant aquifers across Lancashire: a shallow aquifer formed of superficial glacial sand and gravel interbedded with clay (Figure 1) and a deeper aquifer formed by the Sherwood Sandstone Formation (Figure 2).
The shallow aquifer is up to 40 m thick and is designated by the Environment Agency as a secondary B aquifer. It is used for private drinking water supply, farms and golf course irrigation. In the area of former shale-gas site exploration, this aquifer is underlain by a thick layer (up to 350 m) of a low-permeability mudstone, the Mercia Mudstone Group. Water moves slowly through this mudstone and it is not classed as an aquifer. Below this is the Sherwood Sandstone, which reaches a thickness of up to 750 m. The Sherwood Sandstone is classed by the Environment Agency as a principal aquifer.
The Sherwood Sandstone is too deep to be practically accessible in the area below the Fylde. However, to the east of the shale gas exploration (east of the Woodsfold Fault — see Figure 1), the aquifer is much closer to the surface. In this area, it is used for both public and private water supply.
The aquifer units overlie the deeper shale that was the shale gas target. In the area of the former gas exploration site, the shale units occur at some 2000 m below the surface.
Water sampling
BGS established a network of water sampling sites consisting of third-party boreholes, wells and streams within a radius of some 10 km of the Preston New Road (PNR) and Roseacre Wood (formerly proposed) sites (figures 1 and 2). The network comprised 15 groundwater sites from the superficial deposit and Sherwood Sandstone aquifers and 11 streams. We monitored the water quality at these sites from 2015 to 2020.
We also drilled new boreholes in the vicinity of the PNR and Roseacre sites for more detailed groundwater investigation. These were monitored quarterly as for the groundwater sites in the monitoring network from February 2016. A deep borehole (500 m) provided for further characterisation of deep groundwater.
Groundwater-quality monitoring
Monitoring of third-party boreholes and wells, together with newly drilled BGS boreholes, involved sampling and analysis of a wide range of physico-chemical parameters, including:
- water level
- temperature; pH; conductivity; redox potential
- major ions and trace elements
- dissolved gases (O2, CH4, CO2, Rn)
- organic chemicals (for example, total petroleum hydrocarbons; volatile organic compounds)
- stable isotopes (18O,2H of water,13C of inorganic carbon and methane)
- groundwater 'age' indicators (CFCs)
Monitoring equipment installed in the new boreholes provided near real–time measurements of additional water-quality parameters.
Results
Groundwater
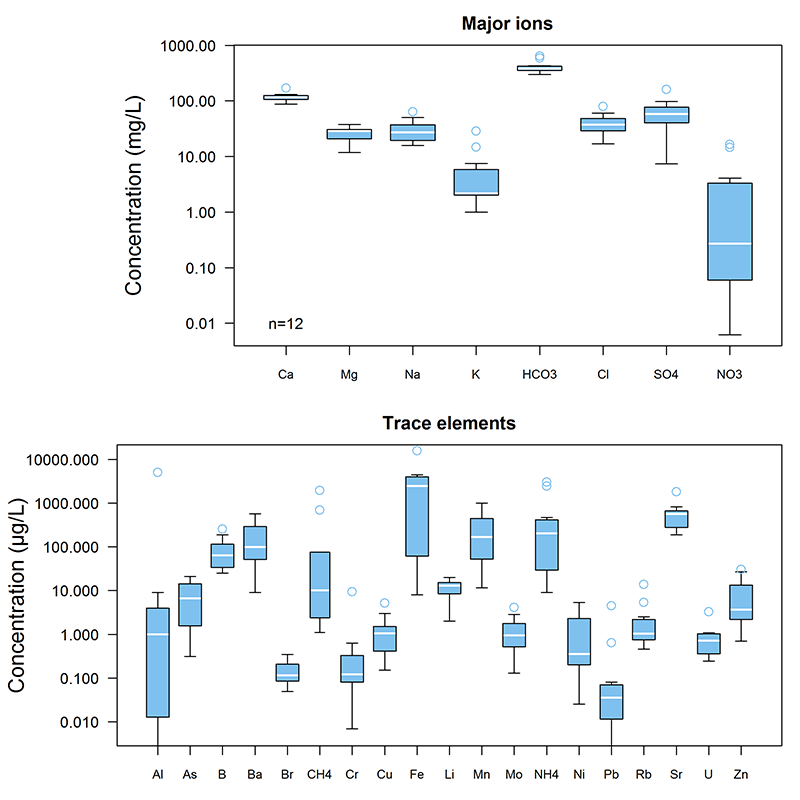
Results from the baseline monitoring of pumped groundwater samples (Figure 3) show that the groundwater in both the superficial deposit and Sherwood Sandstone aquifers has near–neutral pH and is largely anoxic (low or no dissolved oxygen). As a result, concentrations of nitrate (NO3-) are low, those of iron (Fe) and manganese (Mn) are high and concentrations of arsenic (As) and ammonium (NH4+) are high in some. Methane (CH4) is also often detected, though rarely at high concentrations. The composition of CH4, where present, suggests that it has been produced in the superficial sediments by microbial reaction of organic matter.
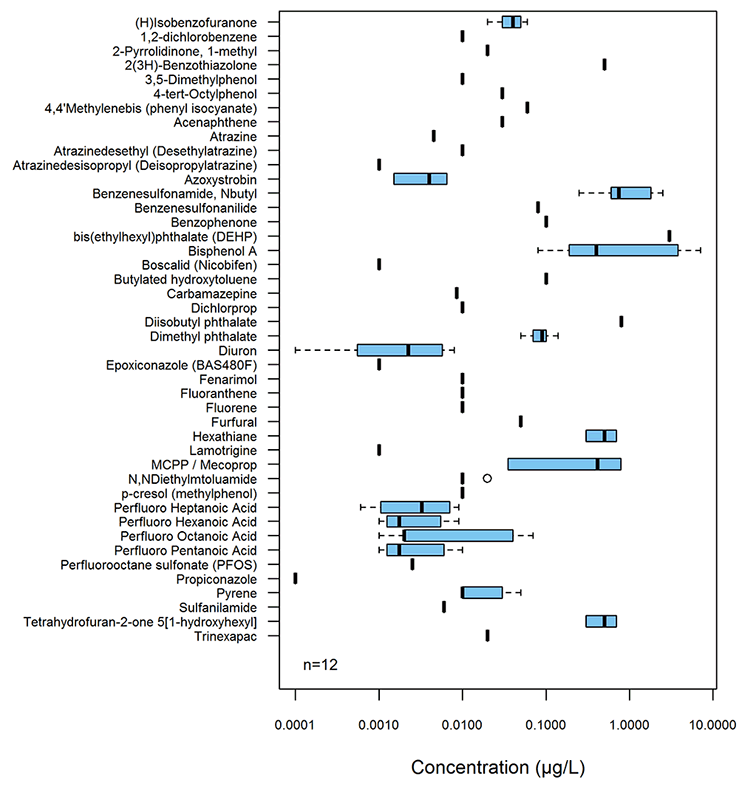
Analysis of organic chemicals suggests that the groundwater contains detectable quantities of some pesticides, perfluorinated compounds and other synthetic chemicals, but the concentrations are low and the numbers of chemicals detected are small. The presence of these substances does, however, indicate effects on the shallow groundwater as a result of human activity (Figure 3).
Monitoring of groundwater in the two aquifers (figures 4, 5 and 6) has shown that the chemical characteristics have been broadly consistent over time. Concentrations of naturally occurring methane up to 4 mg/L are observed in groundwater from the superficial aquifer; concentrations in the Sherwood Sandstone groundwater are generally low (less than 0.7 mg/l).
Surface water
Analysis of water from first-order streams shows generally lower concentrations of dissolved solids than are found in the local shallow groundwater, though with slightly higher concentrations of NO3, nitrite (NO2-) and dissolved organic carbon. Many trace elements also have lower concentrations than local groundwater due to a combination of differing redox conditions and more limited interaction with rocks and soils. Monitoring of stream quality over time showed by far the greatest variability (Figure 7), considered to be due mainly to varying impacts from amounts of rainfall and water turbidity.
Post baseline monitoring
Figures 4, 5, 6 and 7 indicate (grey wash) the initiation of hydraulic fracturing at PNR (October to December 2018 and August 2019) and the subsequent periods. Data from these post baseline dates provide no evidence for impact on water quality from the PNR exploration works. Although concentrations of solutes continued to vary over time, key parameters remained within the baseline range at individual sites.
; grey indicates initiation of hydraulic fracturing at Preston New Road site.")
; grey indicates initiation of hydraulic fracturing at Preston New Road site.")
; grey indicates initiation of hydraulic fracturing at Preston New Road site.")
; grey indicates initiation of hydraulic fracturing at Preston New Road site.")
; grey indicates initiation of hydraulic fracturing at Preston New Road site.")
; grey indicates initiation of hydraulic fracturing at Preston New Road site.")
; grey as for Figure 4.")
; grey as for Figure 4.")
; grey as for Figure 4.")
; grey as for Figure 4.")
; grey as for Figure 4.")
; grey as for Figure 4.")
; grey as for Figure 4.")
; grey as for Figure 4.")
; grey as for Figure 4.")
; grey as for Figure 4.")
; grey as for Figure 4.")
; grey as for Figure 4.")


Contact
Contact BGS enquiries for further information.


