Atmospheric composition in Lancashire

The Universities of York and Manchester together monitored air quality and greenhouse gases at the proposed Cuadrilla shale gas exploration site in Fylde, Lancashire. The monitoring equipment was set up in December 2014 (greenhouse gases) and December 2015 (air quality) and measured concentrations of ozone (O3), particulate matter (PM1, PM2.5, PM4, and PM10), nitrogen oxides (NO, NO2 and NOx), methane (CH4), non-methane hydrocarbons (NHMCs), hydrogen sulphide (H2S) and carbon dioxide (CO2) as well as capturing meteorological information.
Rationale for monitoring
In the context of shale gas exploration and production, atmospheric emissions have a number of potential impacts. Emissions may (both separately and collectively) have implications for climate change, air quality and public and occupational health.
The importance of greenhouse gases
There are numerous sources of greenhouse gases — both natural and artificial. Natural variations of long-lived greenhouse gases, mainly methane (CH4) and carbon dioxide (CO2), relate to soil and deeper sub-surface processes. This signal is augmented by fugitive emissions from vehicle exhausts, industry and landfill. Development of a shale gas exploration programme potentially adds further fugitive emissions from leaks, gas storage, processing operations, frack fluid and flowback. It is important to establish the range of baseline concentrations of greenhouse gases and other air quality parameters before any shale gas operations begin.
Wide variations in the concentration of these gases occur over various timescales as a result of uptake by plants and variations in anthropogenic emissions. Variations can be seen for even minor changes in wind direction, depending on local conditions (e.g. if a road exists nearby). Monitoring of gases over time therefore provides an understanding of the baseline, upon which any changes induced by future activity can be compared quantitatively.
Public health
These parameters concern direct primary emissions ranging from infrastructure onsite (e.g. particulate matter and nitrogen dioxide (NO2) from generators; traffic; plant; flares; dust, and materials handling), to gases that may affect air quality (e.g. non-methane hydrocarbons (NMHCs), and potentially hazardous and harmful trace gases such as benzene (C6H6)). Secondary impacts may occur downwind through reactive chemistry. Unlike greenhouse gases, many of the species mentioned are regulated both for emissions and in ambient air.
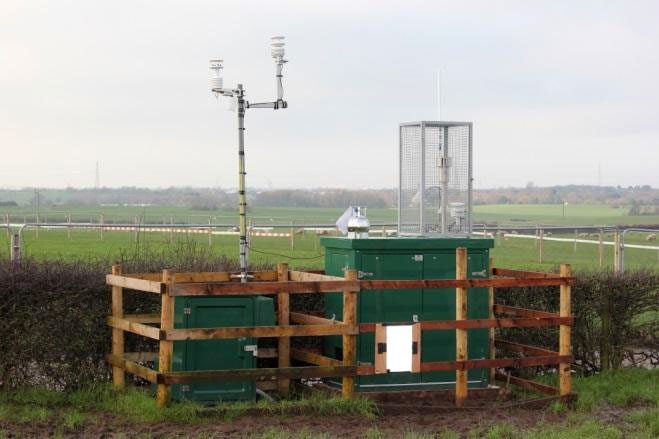
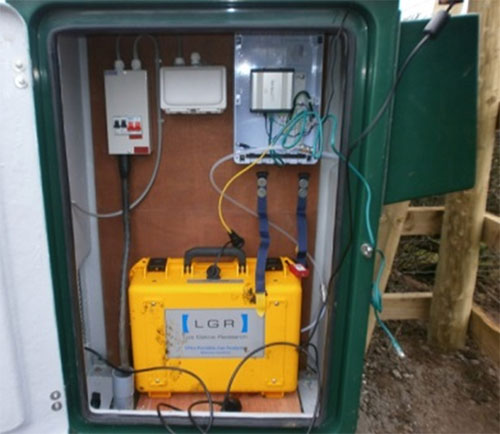
The monitoring site
The monitoring site was located close to the Cuadrilla shale gas exploration site at Little Plumpton (Preston New Road), Lancashire. A waterproof enclosure was installed with instrumentation to measure continuous concentrations of O3, PM, NOx, CH4 and CO2, as well as wind speed and direction, air temperature, and relative humidity. In addition, air samples were taken to the University of York for analysis of a wider range of parameters.
Data interpretation
Meteorology
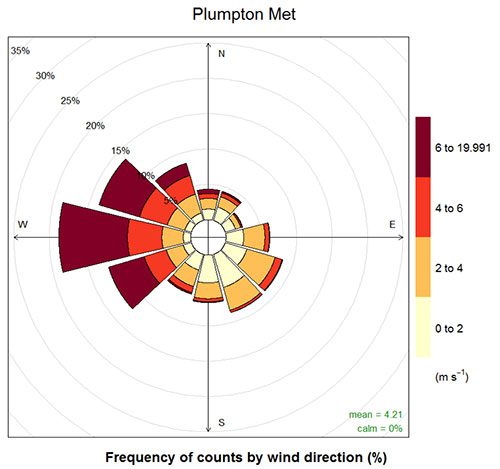
The wind statistics observed over an example measurement period (4 December 2014 to 14 March 2016) are shown in Figure 2 as a conventional wind rose. This type of illustration shows the number of times when wind blows from various directions. The colour scale illustrates the corresponding proportion of winds in each direction for a range of surface wind speeds.
As expected at this site (as for any exposed site in the UK) the dominant wind direction is from the western quadrant (~50% of the time), consistent with the UK's location as an island in the Atlantic mid-latitude storm track. This is also the direction from which the strongest winds are observed (red colours in Figure 2), typically coinciding with the passage of mid-latitude cyclones over the UK mainland.
This is important for understanding the local baseline. The position of the site near to the Blackpool shoreline means that winds bringing air from the Atlantic will typically carry relatively well-mixed and background airmasses to the measurement site. In this context, a background can be conceived to be an airmass relatively unaffected by local or regional pollution sources, broadly representative of the average composition of Northern Hemispheric air at the time.
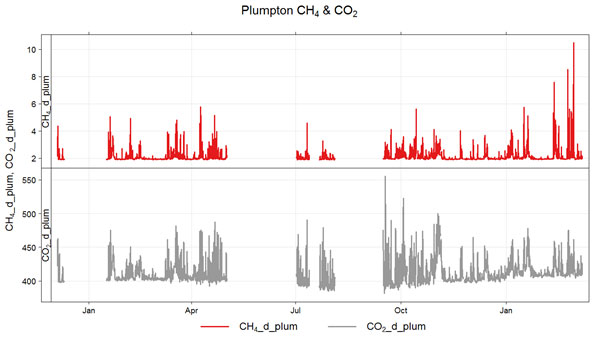
Greenhouse gases
Greenhouse gas concentrations have been measured from December 2014. A time series of the data is shown in Figure 3. A general correlation between CO2 and CH4 can be seen over the measurement period. There are clear periods of background where CO2 and CH4 concentrations appear relatively flat at around 400 parts per million (ppm) and 2 ppm respectively. These periods coincide with westerly winds and represent the relatively unpolluted air from the Atlantic . The periods of generally enhanced CO2 and CH4 (between 400–450 ppm and 2–4 ppm, respectively) are most often with moderate easterly and southerly winds. The short term events (spikes on the graph) coincide most often with light south easterly and northerly wind directions. The elevated concentrations above the background represent a wide mix of pollutant sources upwind, both local and regional, that are being further investigated. It should be noted that the concentrations of greenhouse gases measured are not toxic or known to be hazardous to health.
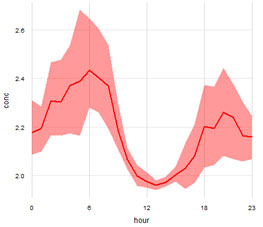
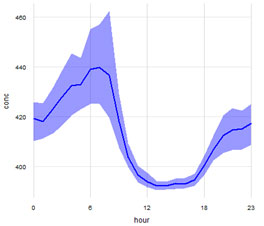
Figure 4 shows a sample of the measured data in Figure 2 for CH4 and CO2 but for a 24–hour period. All measurements over a given hour of day for the dataset period are shown together. This gives an idea of when, during an average day, there were changes in concentration relative to the expected baseline. The bold line is the average for that hour of day and the shaded area is the 95 per cent confidence interval.
The data show that there are relative peaks in both the morning and afternoon, as is generally expected for these species.
Air quality
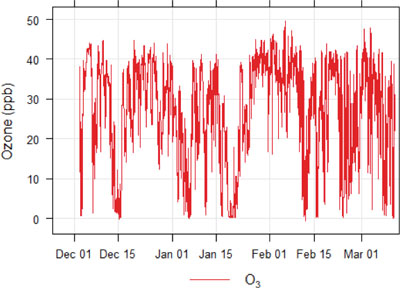
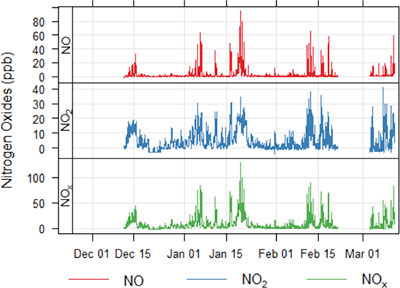
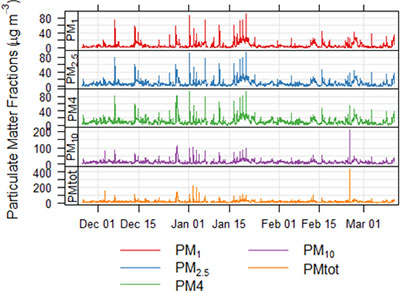
The time series for O3, NO, NO2, NOx, PM1, PM2.5, PM4 and PM10 are shown in Figures 5, 6 and 7. The data indicate that there are times when the site is affected by higher levels of pollution in the form of NO, NO2 and particles (spikes on the graphs). The ozone shows elevated typical maritime concentrations from the west and is indicative of an aged air mass broadly reflective of prevailing Atlantic ozone. The influence of the Atlantic air is also shown in the PM measurements, which are all enhanced when the wind is from the west as a result of maritime aerosols.
Local influence can also be observed as spikes on the graphs. Further investigation is being carried out but a road running close to the site may be a contributory factor.
Measurement statistics
The concentration statistics for the range of parameters measured are shown in Table 1. The mean concentration of methane is slightly above the Northern Hemispheric seasonal average of ~1.9 ppm, while the carbon dioxide site average is marginally enhanced relative to the hemispheric average (~402 ppm). The concentration statistics for the other parameters represent only a limited dataset to date.
| Compound | 10% | 25% | 33% | Mean | 75% | 90% | 95% |
| CH4 (ppm) | 1.93 | 1.94 | 1.95 | 2.22 | 2.12 | 2.68 | 3.66 |
| CO2 (ppb) | 399.13 | 402.52 | 403.74 | 412.83 | 418.16 | 435.12 | 447.34 |
| Compound | 10% | 25% | 33% | Mean | 75% | 90% | 95% |
| O3 (ppb) | 11.37 | 23.77 | 27.43 | 33.32 | 38.85 | 41.21 | 42.73 |
| NO (ppb) | 0.08 | 0.19 | 0.26 | 0.54 | 1.26 | 3.17 | 7.68 |
| NO2 (ppb) | LOD | LOD | 0.13 | 0.96 | 4.65 | 12.99 | 18.93 |
| NOx (ppb) | LOD | 0.20 | 0.59 | 1.60 | 5.72 | 17.36 | 26.15 |
| PM1 (μg / m3) | 1.06 | 1.82 | 2.23 | 3.01 | 5.93 | 12.38 | 18.12 |
| PM2.5 (μg / m3) | 1.92 | 3.31 | 4.04 | 5.57 | 9.40 | 14.49 | 19.59 |
| PM4 (μg / m3) | 2.54 | 4.47 | 5.49 | 7.66 | 11.97 | 17.64 | 21.26 |
| PM10 (μg / m3) | 3.14 | 5.61 | 6.73 | 9.12 | 13.90 | 19.91 | 23.79 |
| PMtotal (μg / m3) | 3.69 | 6.55 | 7.80 | 10.55 | 15.87 | 22.34 | 26.43 |
| Particle Count (particles / cm3) | 15.52 | 22.70 | 27.29 | 41.86 | 143.30 | 369.60 | 490.53 |
NMHC results
Samples for hydrocarbon (C2–C6) analysis were collected weekly in special canisters from both the Little Plumpton (Lancashire) and Kirby Misperton (Yorkshire) sites and returned to the WACL laboratory at York University.
The plots below show the distribution of individual species (ethane, propane and benzene) at the Little Plumpton and Kirby Misperton sites, together with distributions from a site at Auchencorth Moss in Scotland and samples taken from air above BGS's boreholes around Kirby Misperton. The dataset for hydrocarbons from 2016 is available on the BADC website.
, Little Plumpton (LP), air above BGS boreholes (BH) and Auchencorth Moss (AM).")
, Little Plumpton (LP), air above BGS boreholes (BH) and Auchencorth Moss (AM).")
, Little Plumpton (LP), air above BGS boreholes (BH) and Auchencorth Moss (AM).")
Benzene
Annual mean concentration at Little Plumpton: 0.412 ppb
Observed range: 0.046 to 2.4 ppb (n=26 samples over October 2015 to October 2016)
Note: EC Air Quality Directive limit value for benzene (annual mean) = 1.54 ppb. Observations to date indicate a mean baseline concentration around a factor of three lower than the EC Directive limit value.
Contact
Contact BGS enquiries for further information.


