Air quality and greenhouse gas monitoring in the Vale of Pickering

From January 2016 to February 2020, the Universities of York and Manchester were together monitoring air quality and greenhouse gases at the proposed Third Energy shale gas exploration site in Kirby Misperton. The monitoring equipment was set up to measure concentrations of ozone (O3), particulate matter (PM1, PM2.5, PM4, and PM10), nitrogen oxides (NO, NO2 and NOx), methane (CH4), non–methane hydrocarbons (NHMCs), hydrogen sulphide (H2S) and carbon dioxide (CO2) as well as capturing meteorological information.
Rationale for monitoring
In the context of hydrocarbon exploration and production, atmospheric emissions have a number of potential effects. Emissions may have, both separately and collectively, implications for climate change, air quality and public and occupational health.
Public health
These parameters concern direct primary emissions ranging from infrastructure onsite (e.g. particulate matter and nitrogen dioxide (NO2) from generators; traffic; plant; flares; dust, and materials handling), to gases that may affect air quality (e.g. non-methane hydrocarbons (NMHCs), and potentially hazardous and harmful trace gases such as benzene (C6H6)). Secondary impacts may occur downwind through reactive chemistry. Unlike greenhouse gases, many of the species mentioned are regulated both for emissions and in ambient air.
Greenhouse gases
There are numerous sources of greenhouse gases, both natural and artificial. Natural variations of long-lived greenhouse gases, mainly CH4 and CO2, relate to soil and deeper subsurface processes. This signal is augmented by fugitive emissions from vehicle exhausts, industry and landfill. Development of a shale gas exploration programme potentially adds further fugitive emissions from leaks, gas storage, processing operations, fracking fluid and flowback. It is important to establish the range of baseline concentrations of greenhouse gases and other air quality parameters before any shale gas operations begin.
Wide variations in the concentration of these gases occur over various timescales as a result of uptake by plants and variations in anthropogenic emissions. Variations can be seen for even minor changes in wind direction, depending on local conditions (e.g. if a road exists nearby).
Monitoring of gases over time therefore provides an understanding of the baseline, to which any changes induced by future activity can be compared quantitatively.
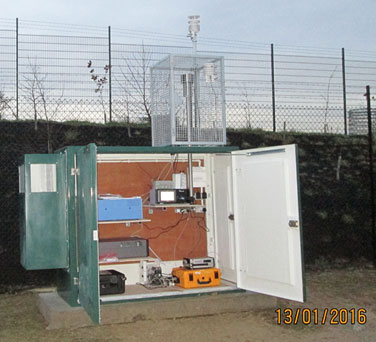
The monitoring site
The monitoring site (Figure 1) was located within the boundary of the Third Energy site. The station consisted of a waterproof enclosure installed with instrumentation to measure continuous concentrations of O3, PM, NOx, CH4 and CO2, as well as wind speed and direction, air temperature, and relative humidity. In addition, air samples were taken in stainless steel canisters and returned to the University of York for analysis of a wider range of parameters.
Data interpretation
Meteorology
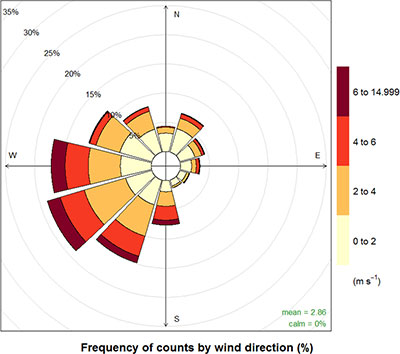
Data for the first few months of wind measurement are shown in Figure 2. This shows that over the winter 2015/16 period the dominant wind direction was from the south west quadrant (~40%), which is also the direction from which the strongest winds were observed. This is consistent with the series of vigorous Atlantic storms experienced over the winter.
Greenhouse gases
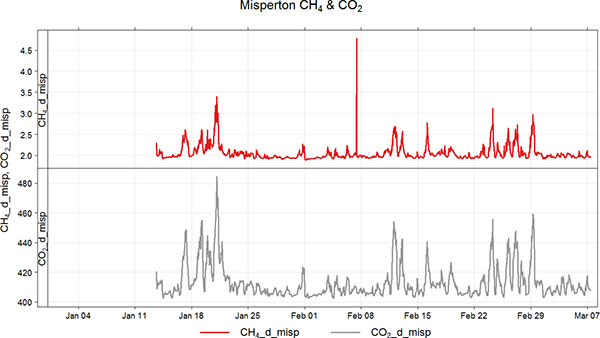
Greenhouse gas concentrations have been measured from 13 January 2016. A time series of the data is shown in Figure 3. A general correlation between CO2 and CH4 can be seen over the measurement period. Concentrations above the background are seen for every wind direction but with a greater tendency when the wind is from the south west (albeit for the very limited dataset).
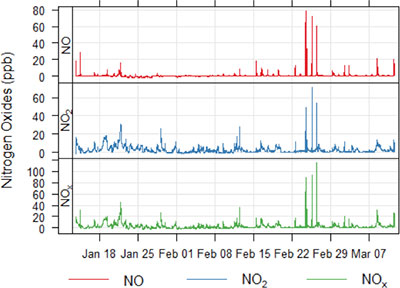
Air quality
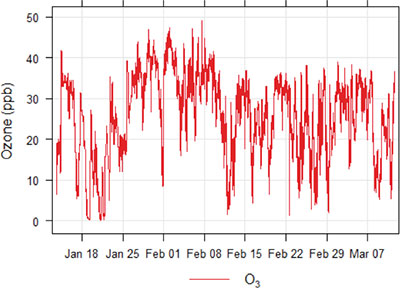
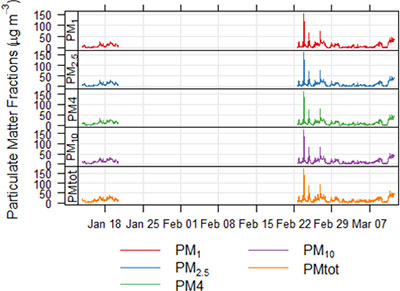
The time series for O3, NO, NO2, NOx, PM1, PM2.5, PM4 and PM10 are shown in Figures 4, 5 and 6. The data gap in the PM measurement is due to an instrument problem. The data indicate that there are times when the site is affected by higher levels of pollution in the form of NO, NO2 and particles (spikes on the graphs). These are likely to reflect emissions from vehicle movements near the site.
Measurement statistics
The concentration statistics for the range of parameters are shown in Table 1. Although there is only a limited dataset, the mean concentration of methane is similar to the Northern Hemispheric seasonal average of ~1.9 ppm, while the carbon dioxide site average is marginally enhanced relative to this wintertime hemispheric average (~402 ppm).
| Compound | 10% | 25% | 33% | Mean | 75% | 90% | 95% |
| CH4 (ppm) | 1.94 | 1.96 | 1.97 | 2.06 | 2.08 | 2.26 | 2.45 |
| CO2 (ppm) | 404.73 | 405.93 | 406.92 | 412.97 | 414.30 | 428.40 | 439.25 |
| O3 (ppb) | 13.36 | 21.35 | 23.93 | 28.92 | 34.01 | 38.44 | 40.53 |
| NO (ppb) | LOD | 0.03 | 0.05 | 0.10 | 0.27 | 0.83 | 1.66 |
| NO2 (ppb) | LOD | 0.37 | 0.63 | 1.27 | 2.61 | 4.97 | 6.54 |
| NOx (ppb) | LOD | 0.41 | 0.68 | 1.41 | 2.92 | 5.51 | 7.86 |
| PM1 (μg / m3) | 1.17 | 2.17 | 2.92 | 5.19 | 13.10 | 23.53 | 29.71 |
| PM2.5 (μg / m3) | 1.78 | 3.08 | 3.87 | 6.57 | 14.49 | 24.94 | 31.76 |
| PM4 (μg / m3) | 2.28 | 3.86 | 4.84 | 7.79 | 15.66 | 26.00 | 33.15 |
| PM10 (μg / m3) | 2.79 | 4.55 | 5.80 | 8.98 | 17.68 | 27.85 | 34.83 |
| PMtotal (μg / m3) | 3.17 | 5.34 | 6.75 | 10.29 | 19.75 | 30.78 | 38.26 |
| Particle Count (particles / cm3) | 28.83 | 57.92 | 78.73 | 154.20 | 407.60 | 573.96 | 682.93 |
NMHC results
Samples for hydrocarbon (C2–C6) analysis have been collected weekly in special canisters from both the Little Plumpton (Lancashire) and Kirby Misperton (Yorkshire) sites and returned to the WACL laboratory at York University.
The plots below show the distribution of individual species (ethane, propane and benzene) at the Kirby Misperton and Little Plumpton sites (Kirby Misperton: 87 samples from November 2015 to August 2017; Little Plumpton: 65 samples from October 2015 to August 2017). The dataset for hydrocarbons is available on the BADC website.


Note: EC Air Quality Directive limit value for benzene (annual mean) = 1.54 ppb. Observations to date indicate a median baseline concentration around a factor of ten lower than the EC Directive limit value.
Contact
Contact BGS enquiries for further information.


