Monitoring
Air composition Groundwater quality Seismicity
BGS data overlay
Base map
 | Rocks with essentially no groundwater |
| Aquifers with significant intergranular flow | |
 | Highly productive aquifer |
 | Moderately productive aquifer |
 | Low productivity aquifer |
| Aquifers in which flow is virtually all through fractures and other discontinuities | |
 | Highly productive aquifer |
 | Moderately productive aquifer |
 | Low productivity aquifer |
| Less than 1% | |
| 1 – 3% | |
| 3 – 5% | |
| 5 – 10% | |
| 10 – 30% | |
| Greater than 30% | |
|
The indicative radon map shows radon Affected Areas on a 1km grid.
The darker the colour the greater the chance of a higher level. The chance is less than one home in a hundred in the white areas and greater than one in three in the darkest areas. | |
|---|---|
 Find out more about Environmental baseline monitoring in Lancashire
More information and data can be found from the
CEDA Archive
and
WACL data portal.
Find out more about the Atmospheric composition in Lancashire
These data are provided live to the website. No quality assurance or data validation has been carried out and the data may include anomalies related to sensor maintenance, calibration or malfunction. Final validated datasets may be subject to change.
pH
interactive graph*
Specific electrical conductance
interactive graph*
Total dissolved gas
interactive graph*
Water level
interactive graph*
Water temperature
interactive graph*
*Interactive graphs will plot the selected parameter for all sensors. The graphs show data from the start of the dataset to the latest measurements received.
The data are made available under the Non-commercial Government Licence,
subject to the following acknowledgement accompanying the reproduced BGS materials: "Contains British Geological Survey materials ©NERC [year]".
You must contact BGS Enquiries if you wish to use this data commercially.
** Downloads are available as yearly ZIP files each containing 1-12 months of CSV data for all the measurements from a sensor. The latest download will be updated daily.
For further details please see Groundwater monitoring in Lancashire
The images show a day of seismic data for a single channel. Each horizontal line is 30 minutes long with the start time given on the left axis and each vertical line marking one minute. The times are in UTC (or GMT) and so are an hour behind local time in summer.
The colours are simply to make interpretation easier. Seismic activity is shown when a line goes from flat to moving up and down. This is most likely to be something local to the station - a passing tractor or large animal. Earthquakes are distinct because they cause activity on several stations at the same time.
| Station Code | Station Name | Real-time Seismograms * |
|---|---|---|
| * Click a date to view the Helicorder trace for the day | ||
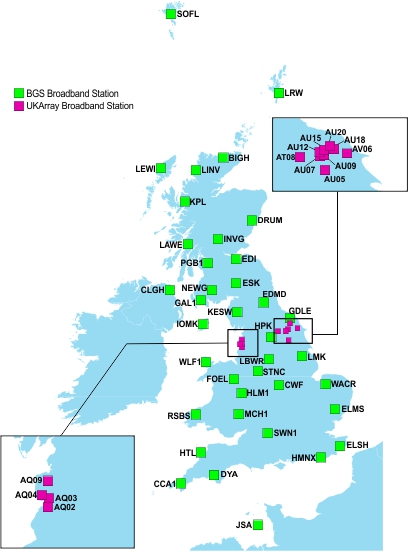
UK seismic network map
For further details please see our Seismic Monitoring pages.
The indicative radon map shows radon Affected Areas on a 1km grid. The darker the colour the greater the chance of a higher level.
The chance is less than one home in a hundred in the white areas and greater than one in three in the darkest areas.
| Less than 1% | |
| 1 – 3% | |
| 3 – 5% | |
| 5 – 10% | |
| 10 – 30% | |
| Greater than 30% |
For further details please see Monitoring radon in air
 Hydrogeology key


