How to use the Climate through time poster
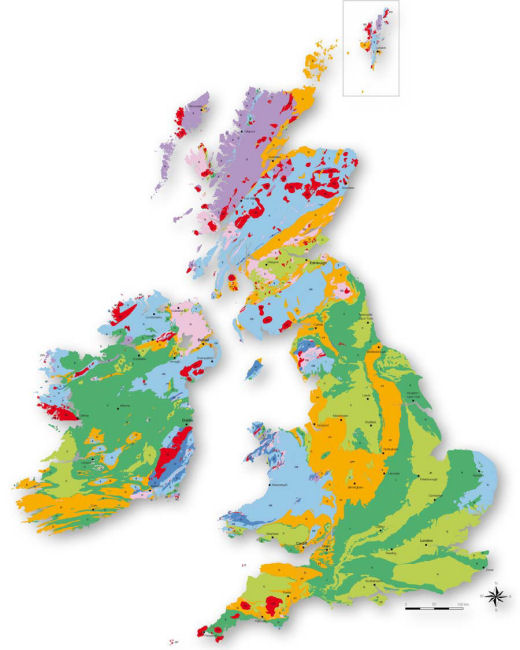
The 'Climate through time' poster shows the rocks of Britain and Ireland grouped and coloured according to the environment under which they were formed. This can be seen on the map in the centre of the poster.
Map key
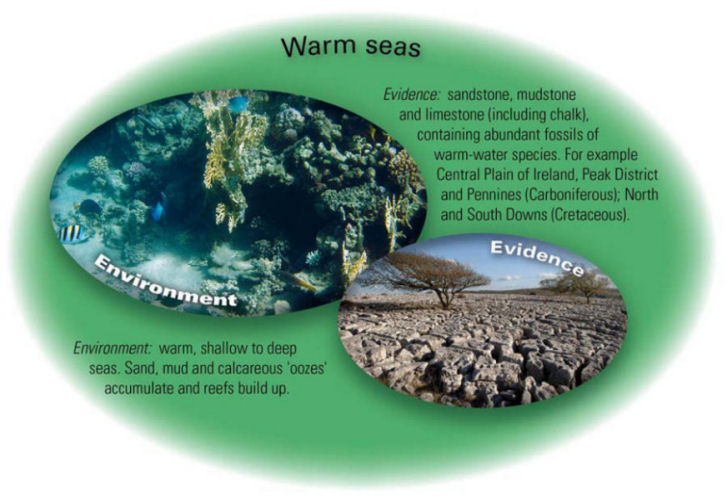
A key to the colours used on the map are in the coloured ovals surrounding it. Each environment is represented by a different colour — for example: warm seas are coloured dark green.
Each oval in the key also contains an illustration of a modern-day rock-forming environment alongside an image of a typical rock-type laid down under those environmental conditions — this provides evidence for the existence of the environment in the geological past.
Alternate sandstones, limestones and mudstones...
For instance, a modern-day warm sea leads to a build-up of sand and muddy ‘oozes’ on the sea floor, which may eventually form sandstones, limestones and mudstones.
Such rocks can be found today across Ireland, the Peak District and the North and South Downs. This tells us that at one time, warm seas must have sparkled where today we have land.
From warm seas to tropical swamps...
You will notice that much of southern England is coloured in two shades of green.
The key tells us that at one time, the environment of this area alternated between warm seas and tropical swamps — the sandstones, limestones and coal which are found in southern England today tell us of the past environments which affected the types of rocks which were laid down in the distant past.
How old are the rocks?
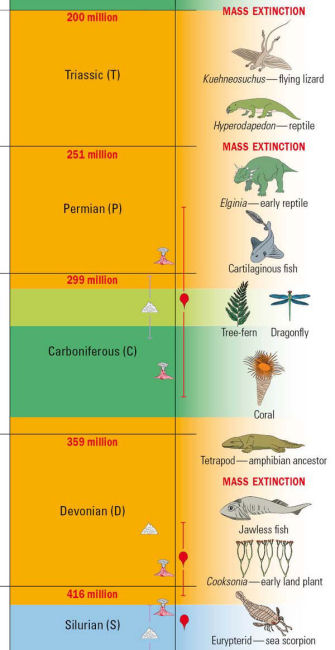
The ages of the rocks are shown in the timeline on the left of the poster. The timeline is also coloured to match the environments on the map face and in the key.
Most of the environments shown on the map are not unique to a particular geological period of time, so letters are used on both the map and the timeline to identify the geological age of the rocks.
Desert rocks return time after time
You can see straight away that, for example, deserts (coloured orange) occurred across northern and southern Scotland, across much of England, and in southern Ireland.
But these deserts were present at different times in different places because the changing climate has created desert conditions more than once.
Most of the desert rocks from Scotland, Ireland and southern England were laid down under desert conditions during the Devonian Period (around 400 million years ago).
However, the desert rocks found across much of the English Midlands were formed when similar hot conditions returned during the Permian and Triassic Periods, some 250 million years ago. This can be seen on the map face by different letters indicating rocks of Devonian (D), Permian (P) or Triassic (T) age.
Moving plates and shifting sands

It is important to remember that those deserts would have covered the whole of Britain and Ireland, not just those places coloured orange on the map.
So why are desert sandstones only found in a few areas nowadays?
The answer is a long history of erosion, burial and plate tectonic forces — as Britain and Ireland have moved northwards across the planet, they have at different times been completely or partially submerged beneath the sea while, at other times, they have been exposed as part of a continental landmass.
Mountain-building episodes raise the land surface, increasing the rate of erosion by wind and water, and tilt the rock strata so that rocks of different ages are exposed in different parts of the country.
Very hot, then very cold
Changing climates also mean that environmental conditions change — as rivers form, change course, and dry up, erosion methods and patterns change, and so different rock types are deposited.
New rocks are laid down on top of older ones — if you were to drill a borehole tens of metres into the Earth you would find that the rocks buried deep in the Earth are generally far older than the rocks you see at the surface.
This long history of deposition, uplift, and erosion, often repeated in cycles, means the record preserved in the rocks of Britain and Ireland has an intricate three-dimensional structure of which the map shows only the patterns exposed at the surface.
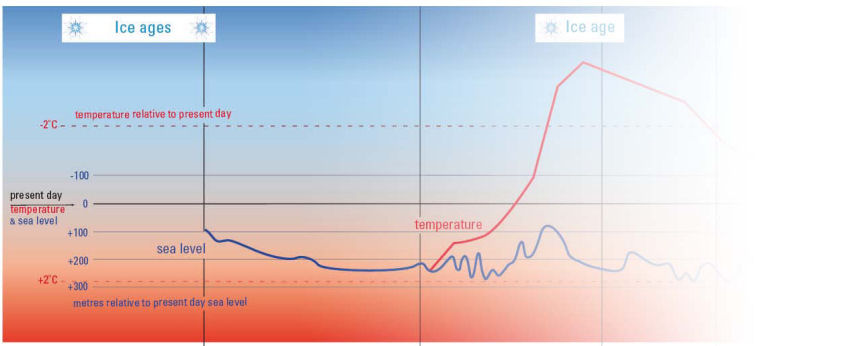
Also in the timeline are curves showing the global sea-level and temperature through time, relative to their values today.
Do you live in what was an ancient desert or tropical sea?
Why not find where you live on the map?
From the colour, find out what environmental condition existed at the time the rock beneath your house or school was laid down.
See what that environmental condition looks like today. How old are the rocks in your town?
Where were Britain and Ireland on the face of the planet at the time?
Look for times of ice ages. Does the global temperature drop at the same time?
What about the sea level?
Would you expect to see sea levels drop as water is locked up as ice? Is this what actually happens? Sometimes it does not.
This is for a number of inter-related reasons — it is not only climate which influences sea level; the shape and arrangement of continents on the globe can greatly affect sea level, as land-masses alter global circulation patterns. When dealing with a dynamic planet, things are never straightforward, but this poster gives an insight into the relationship between the rock record, shifting continents and the changing climate.
- Download Climate through time as a PDF — low res version 9MB pdf
- Download Climate through time as a PDF — high res version 20MB pdf
- A teachers' guide to activities for secondary school students (11-18)
- Order printed Climate through time posters from our Online Shop
Acknowledgements
The poster was jointly produced by the BGS, the Geological Survey of Northern Ireland and the Geological Survey of Ireland.
It has been endorsed by a range of teaching organisations and examining bodies. Including the Association of Geography Teachers of Ireland, the Earth Science Teachers' Association, WJEC, and OCR.
The BGS would like to thank the input and feedback we received during production of this poster. We would especially like to thank Chris King, Dawn Windley, Pete Loader, Mick de Pomerai, Ruth Richards and Nikki Edwards for their invaluable ideas and constructive comments.
Contact
For more information contact Enquiries